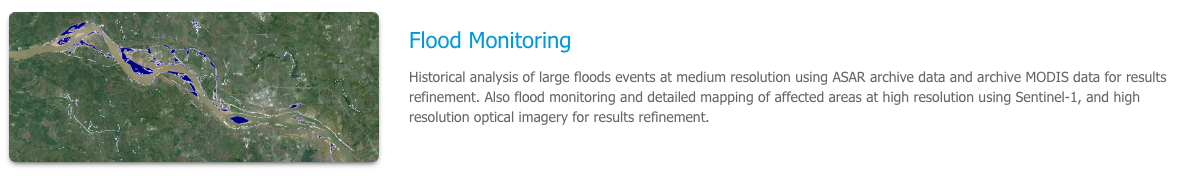
6.2. Flood monitoring
Historical analysis of large floods events at medium resolution using ASAR archive data and archive MODIS data for results refinement. Also flood monitoring and detailed mapping of affected areas at high resolution using Sentinel-1, and high resolution optical imagery for results refinement. Several functionalities are included within the Flood Monitoring service besides single flood maps between two dates. These are the automatic flood map generation mode, the selection of a reference of water content and some statistics (flood frequency map, water frequency map, Maximum Flooded area and Time Series).
6.2.1. Access to the thematic application
From the thematic application page, click on the Flood monitoring application.
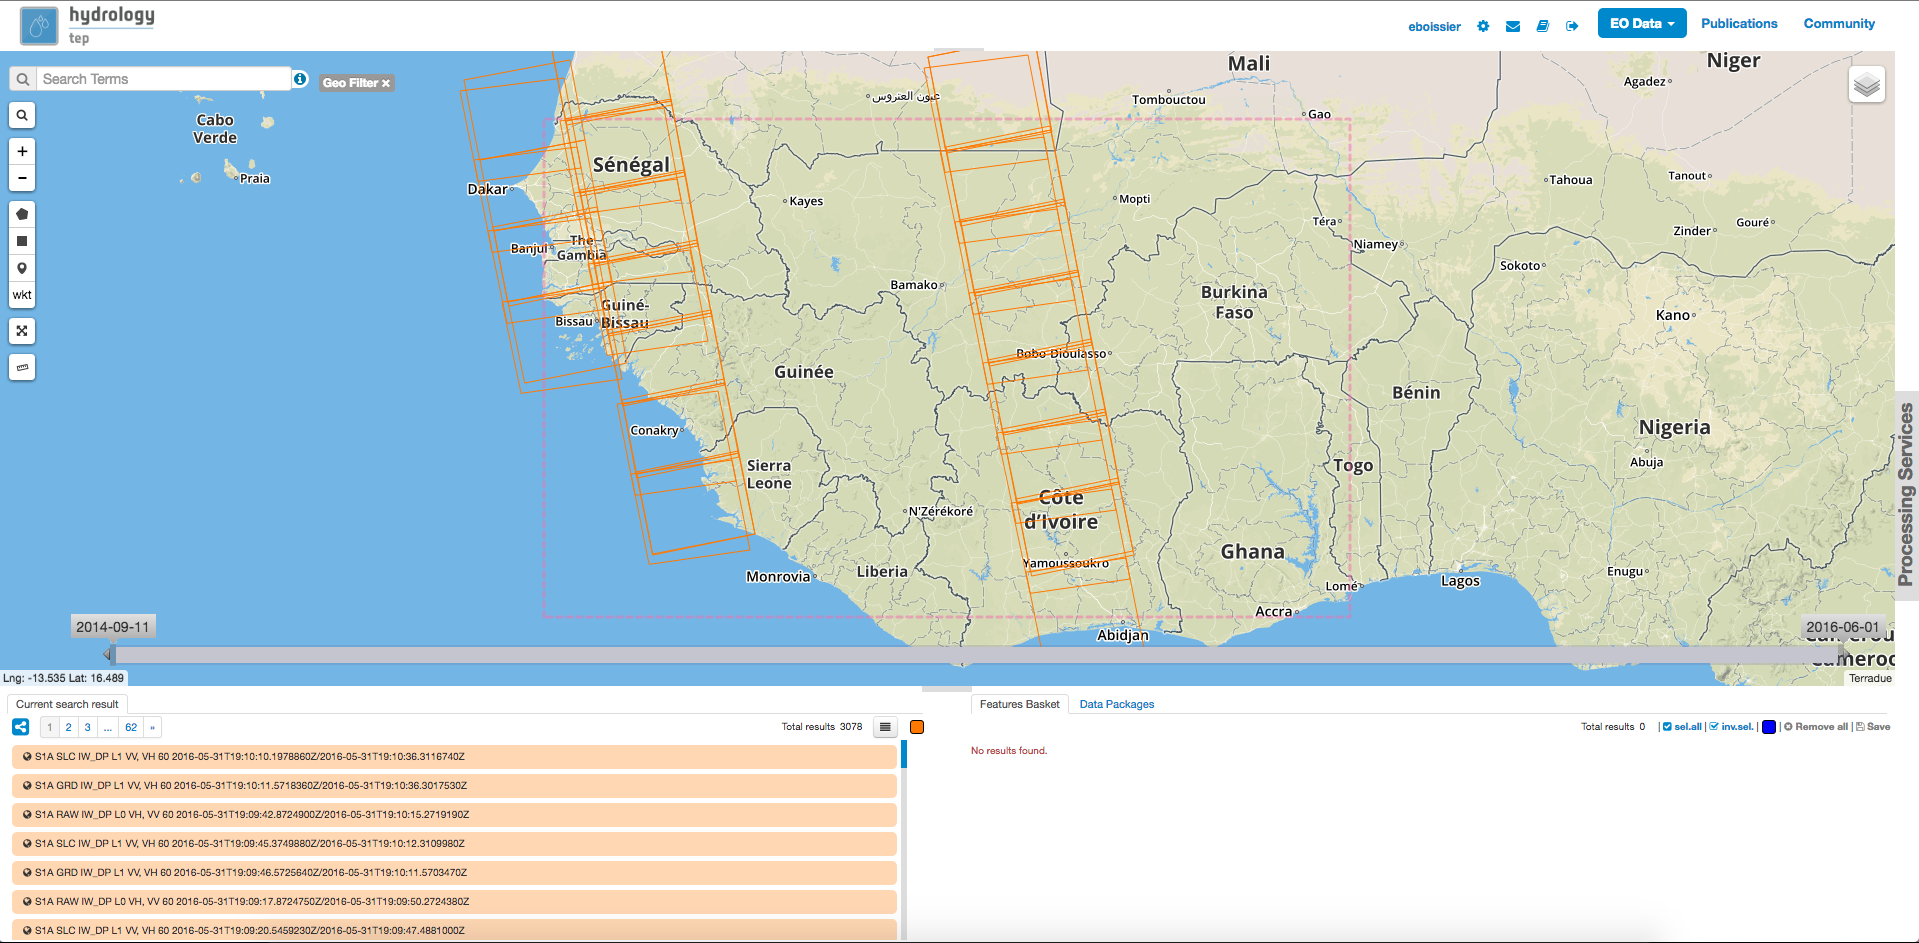
A new page with the geobrowser, data collections and processing services associated to the Flood monitoring application will appear.
6.2.2. Run the flood map extent processing service
Open the Processing Services tab on the right of the geobrowser.


Select the Flood map extent service.
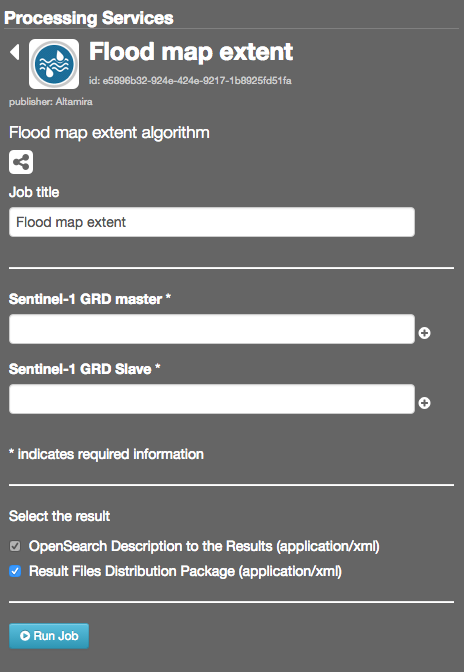
Select data from the search result panel, or from a data package, and drag and drop the selected data into the Sentinel-1 GRD master and Sentinel-1 GRD slave input. As an example, you can find suitable data in the data package named Flood mapping tutorial (see how to select a data package).
Then click on the Run job button.
